Import a CSV and export a finished ranking video: up to 4K for YouTube, 9:16 for Shorts, TikTok and Reels. No screen recording, no account, nothing uploaded.
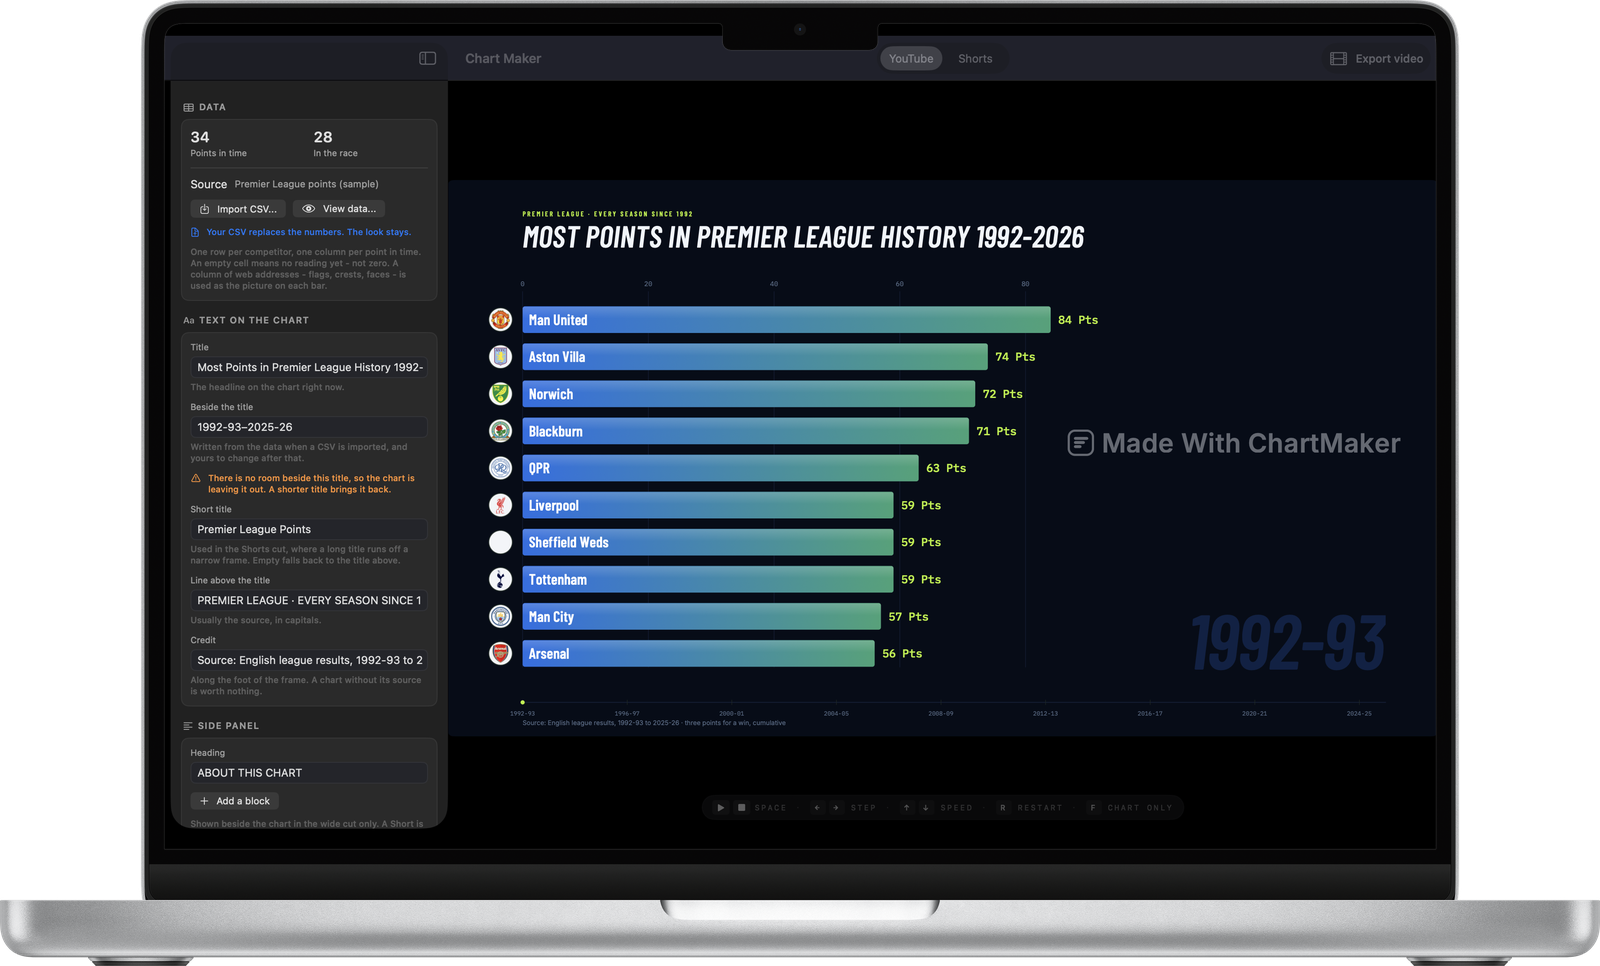
Most bar chart race tools live in a browser and hand you an embed. This one hands you the file.
Recorded frame by frame at the exact size of the finished frame, up to 3840×2160. It comes out identical every time, whatever else the machine is doing.
16:9 and 9:16, switched with one control. The vertical cut keeps both edges clear of the platform’s own buttons.
Three templates, each taken from a chart with published videos behind it. No font picker: a free choice of font is how a chart made in five minutes comes out looking like it.
Semicolons, decimal commas, currency symbols and quoted names. An empty cell stays empty instead of becoming a zero, and a table shows you exactly what was read.
265 round country flags ship inside the app. Any column of image addresses in your own file is drawn on the bars instead.
No account, no cloud, no upload. Your spreadsheet, your pictures and your finished video never leave the machine.
Four steps from a spreadsheet to an upload. The first video takes about ten minutes; the next one takes two.
Open the app and choose one of the three templates. Each arrives with a finished chart in it.
One row per competitor, one column per point in time. Your numbers replace the template’s and the styling stays.
Title, the line above it, the credit along the foot. Set the pace and watch the finished length update beside the slider.
16:9 or 9:16, full size or half, 30 or 60fps. The panel says how many frames and roughly how long before you start.
The preview is the same page the exporter records, at the same shape, so what you see is what uploads.



The free version renders at full resolution with no limit on how many videos you make. It signs them with a small mark, which one payment removes forever.
How to shape the data, how to get the video out, and how to make it look like the ones that get watched.
Four steps, from a spreadsheet to a finished MP4. No code, no After Effects, no account.
Read the guide →The layout, the column names that are recognised, and the two mistakes that make a finished chart look wrong.
Read the guide →A real video file, up to 3840×2160, written frame by frame, not a recording of a browser window.
Read the guide →The same project, exported in 9:16, and laid out for a frame nobody ever sees whole.
Read the guide →Your sheet is already most of the way there. Here is the layout, the export, and the traps that come with spreadsheet files.
Read the guide →Two ways to get a picture onto every bar: a country code, or a column of addresses in your own file.
Read the guide →What the mark is, what one payment removes, and what is identical either way.
Read the guide →Flourish is very good at what it is for. If what you need is an MP4, it is the wrong end of the tool.
Read the guide →The things people ask before they download it.
An animated ranking: one bar per competitor, ordered by value, re-sorting itself as it moves through time. It is the format behind most of the “most valuable companies” and “most points in history” videos on YouTube and TikTok. Learn more →
Pick one of the three shipped looks, import a CSV with one row per competitor and one column per point in time, edit the title and the pace, then export. Four steps, no code and no account. Learn more →
Yes: a real video file, up to 3840×2160 at 30 or 60fps, written frame by frame rather than screen-recorded. A screen recording is at the mercy of whatever else the machine is doing and comes out the size of a window. Learn more →
One row per competitor, one column per point in time: a year, a season like 1992-93, or a date. The first column is the name. An empty cell means no reading yet, which is not the same as a zero. Learn more →
Yes. The same project exports 16:9 for YouTube and 9:16 for Shorts, TikTok and Reels, and the vertical cut is laid out for it; wider margins so the platform’s own buttons do not sit on your bars. Learn more →
The app is free forever and exports at full resolution with no limit. Free exports carry a small MADE WITH mark, and one payment removes it from every video, for good. No subscription. Everything else is identical. Learn more →
For video, yes. Flourish is excellent for embedding an interactive chart in an article, but it has no MP4 export outside an enterprise contract, so creators screen-record it. This app hands you the file instead. Learn more →
Yes. 265 round country flags ship inside the app and are matched from a two-letter code, and any column of image addresses in your own file (crests, logos, faces) is drawn on the bars instead. Learn more →
Yes. Export the sheet as CSV and import it. The reader handles what real exports contain: semicolons or tabs, decimal commas, currency symbols, Windows line endings and Excel’s byte order mark. Learn more →
No. There is no account, no cloud and no upload. The only thing the app ever fetches is a picture your own file points at by web address, and it tells you when one does not answer. Learn more →
Point the app at a CSV and find out what it looks like moving. Free to download, free to export, and the whole thing runs on your own machine.
Download on the App Store Chart Maker